ROADSIDE REVEGETATION
An Integrated Approach to Establishing Native Plants and Pollinator Habitat

2.4 Road Construction Plans
This section explains how to use roadway engineering views for revegetation planning, including determining the vegetation zones that begin where the pavement ends. A glossary with illustrations is provided in order to understand technical concepts and terminology for effective communication with others involved in road design and construction. This section explains how to read and interpret:
- Plan views
- Profile views
- Cross-section views
- Typical views
- Summary of quantities tables
The plan set consists of construction drawings and specifications for each section of road or project. The four most common views of plans utilized by the designer are plan views, cross-section views, profile views, and typical views. Each of these is defined in Table 2-1. Examples and descriptions for interpreting each of these views are provided below. Each engineering plan includes a legend defining abbreviations and symbols as well as a summary of plan quantities table.
Table 2-1 | Definitions of views
View |
Definition |
Plan |
A drawing depicting a portion of the road project from a bird's eye view. |
Profile |
A drawing depicting the vertical plane section along the longitudinal centerline of the road, expressed in elevation or gradient. |
Cross-section |
A drawing depicting a horizontal section of the road viewed vertically, as if cut across the width of the road. |
Detail |
A drawing depicting features of a particular design, installation, construction or methodology. |
Source: Keller and Sherar 2003 |
|
2.4.1 Plan view
The plan view shows the existing and proposed road locations from a bird's eye view. It is important to note that plan sets, in particular road plans, historically displayed distances in meters. This practice was discontinued nationwide in the early 2000s and distances are now displayed in US Customary Units (feet). The proposed road is usually designated with solid lines (Figure 2-2A). The solid centerline (of the road to be constructed) is divided into 100 foot sections (large ticks), often with 20 foot subdivisions also designated (small ticks—not shown). Each 100 foot division is called a station, representing a discrete, surveyed, and identifiable point within the road corridor. Each station is identified with a unique number that indicates its distance from the beginning of the project. For example, the station 19+000 indicates this point is 19,000 feet from the start of the project; 19+040 indicates this point is 19,040 feet from the start. This short-hand identifier is also used to indicate the placement of road-related infrastructure, such as culverts, the beginning and end of guard-rail construction, or the placement of a sign. In the field, stations are identifiable as vertically aligned numbers written on wooden stakes and driven into the ground, facing the roadway. Detailed location of elements off of the roadway can then be identified by station along the centerline of the alignment plus the offset distance dimension from the edge of roadway pavement. This will appear as a +0.00 note on the field stake. Not only do the stations provide locations, they help to locate revegetation units. The plans also show the top of the cut slope (Figure 2-2B, dotted line), bottom of the fill slopes (Figure 2-2C, dashed lines), and the location of the original road, which will be obliterated in this example (Figure 2-2D, shaded area). Plans also include temporary construction easement lines (Figure 2-2D (outside line)) and right-of-way lines (ROW or R/W). These are, in effect, the property lines of the roadway and an important boundary for the designer.
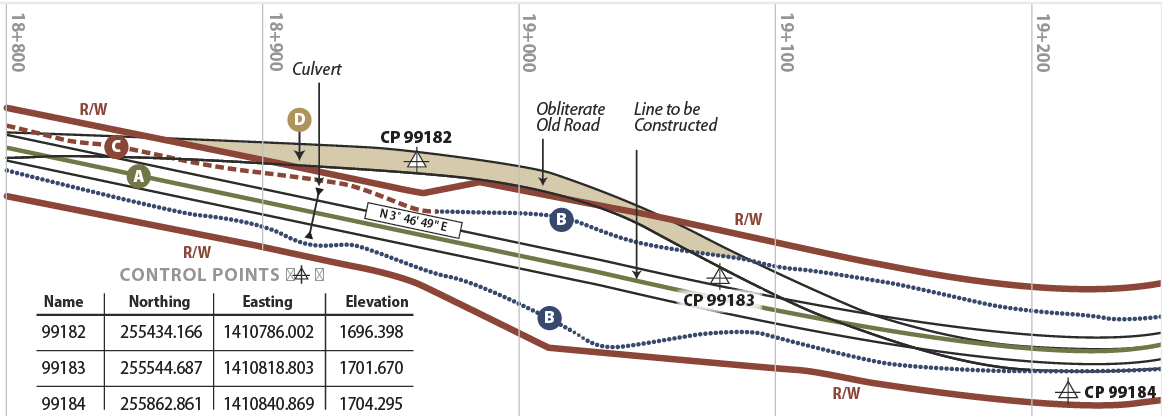
Figure 2-2 | Example plan view
2.4.2 Profile View
The profile view is a trace of a vertical plane intersecting a particular surface of the proposed road construction (Figure 2-3E). It corresponds to the longitudinal centerline of the road bed in the plans. Profile grade means either elevation or gradient of the trace, depending on the context. The trace of the existing road is shown as a dashed line (Figure 2-3F) and a dotted line (Figure 2-3G). A vertical scale provides useful information about the profile of construction grades throughout the project. This view shows where the proposed road will be lower than the existing road (Figure 2-3H) and areas where it will be higher (Figure 2-3 I). Where the planned road is lower, material will usually be removed and used in areas needing fill. Additional information is often displayed adjacent to and locatable by the station numbers, such as volumes of excavation and embankment work, guard-rail placement, or wall placements.
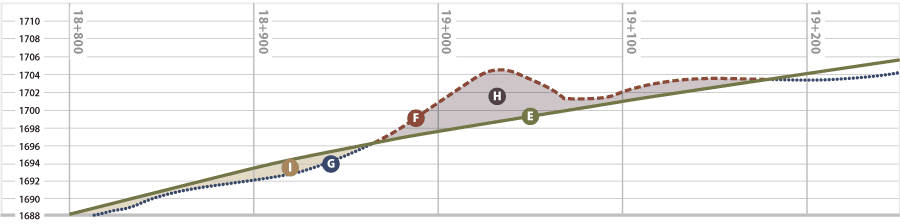
Figure 2-3 | Example profile view
2.4.3 Cross-Section View
Cross-sections are views of the slopes perpendicular to the direction of the road. They display a vertical section of the ground or structure at right angles to the centerline or baseline of the roadway. Depending on the length and topographic complexity of the road, there can be hundreds of cross-sections. Each cross-section is referenced back to a station. For example, the cross-section shown in Figure 2-4 depicts the slope at Station 18+940. It shows the proposed road (Figure 2-4J), and the natural ground line as a dotted line (Figure 2-4 K). This section will have material brought in and placed as fill (Figure 2-4L). The cross-section in Figure 2-5 shows a through cut at 19+000. Material will be removed from the natural ground line (Figure 2-5K) to the proposed ground line/solid line (Figure 2-5 M).
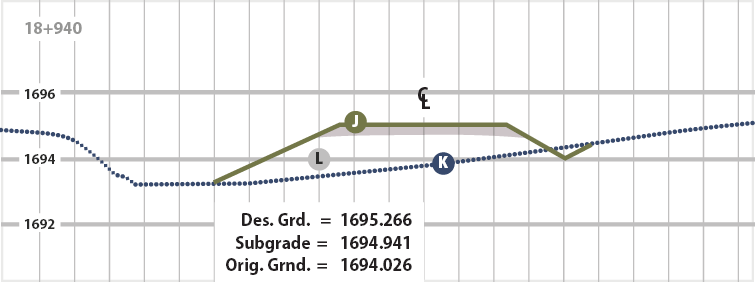
Figure 2-4 | First example cross-section
Cross-section and plan views are used together to view the proposed road three-dimensionally. From these views, a more detailed revegetation plan can be developed. Each cross-section can be reviewed and a set of revegetation criteria can be developed for similar cross-sections throughout the project.
Cross- sections show the proposed slope gradients for cut and fill slopes and provide the designer a means to determine slope steepness. Like stationing, the method of depicting slopes has changed over the years. Older plan sets often depicted slopes as a ratio of one unit horizontal to one unit vertical. Several years ago, however, slope ratios were brought more in line with other disciplines and are now depicted as one unit vertical to one unit horizontal (vertical:horizontal). When slopes are flatter than 1:1 (45° or 100%), the slope is expressed as the ratio of one unit vertical to the number of units horizontal. For slopes steeper than 1:1, the slope ratio is expressed as number of units vertical to one unit horizontal. To avoid confusion, it is wise to notate the ratio by indicating the vertical and horizontal, for example 1V:2H, and to think in terms of rise over run (Figure 3-61).
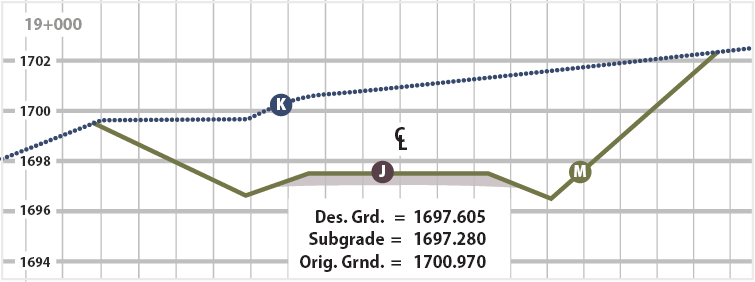
Figure 2-5 | Second example cross-section
2.4.4 Typical Views
Typical views graphically illustrate the design or construction details of the structures or other components that will be encountered in the road project (Figure 2-6). They can cover such structures as retaining walls, road surfaces, guardrails, ditch lines, plant installation, etc. They may be shown in profile, cross-section, or plan views (Figure 2-7). Like special contract requirements (see above), typical views are useful in helping communicate a new or modified approach to an existing methodology or construction technique.
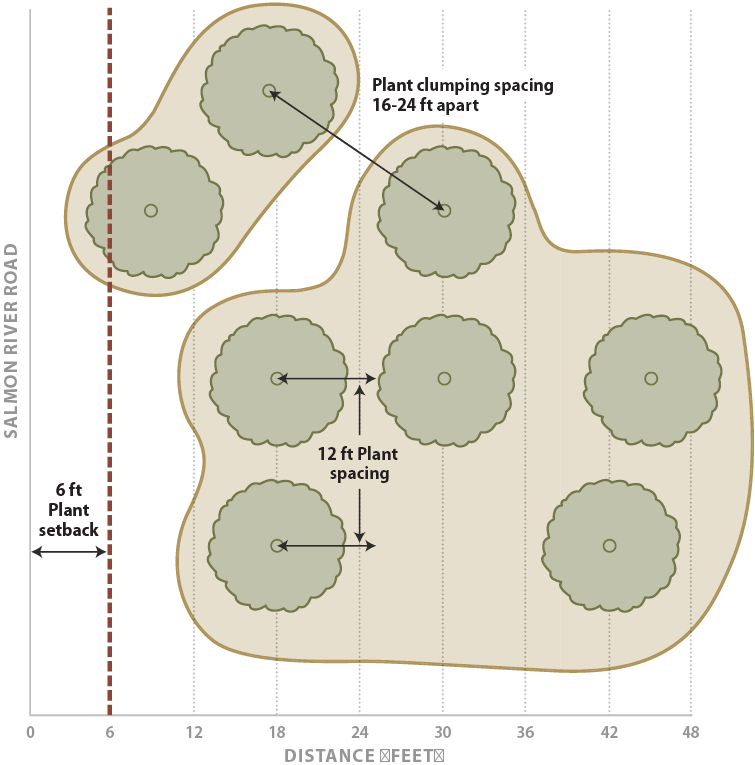
Figure 2-6 | Example typical view
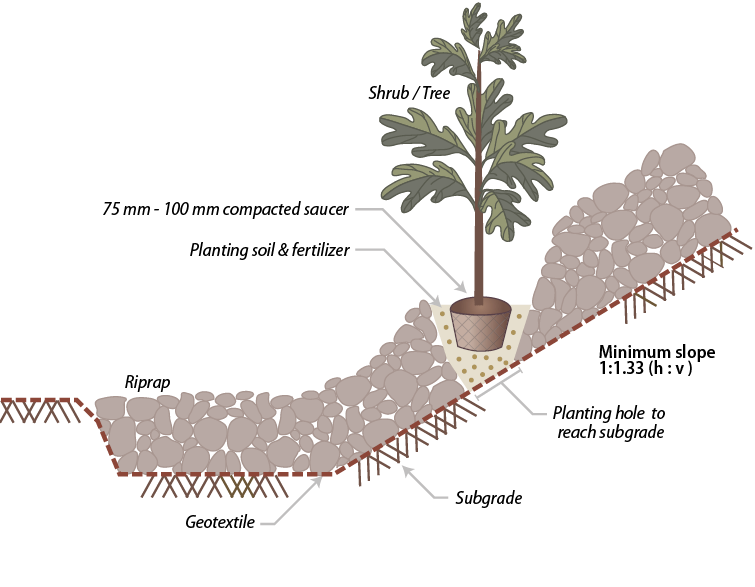
Figure 2-7 | Example typical view of installation trail and turnout
2.4.5 Summary of Quantities Table
Tabulation of plan quantities tables contain details on quantities, types of materials, and performance specifications. Standardized specifications for construction of federal roads are described in the FHWA handbook: Standard Specifications for Construction of Roads and Bridges on Federal Highway Projects. The specifications are cited as "FP-03," or "FP-14", indicating "Federal Project" Standard Specifications issued in 2003 or 2014, respectively. The state departments of transportation have analogous manuals. Tabulation of plan quantities references not only the particular item specification number in the FP manual, but also the station number(s) of the planned work. Information of special interest for the designer includes the number of hectares of clearing and grubbing, hectares of obliterated roads listed by station, and the number of cubic meters of wood mulch to be produced. The summary of quantities table provides a summary of all tabulation of plan quantity tables contained within the plan. It generally does not include station numbers.