ROADSIDE REVEGETATION
An Integrated Approach to Establishing Native Plants and Pollinator Habitat

3.3 Gathering Pre-field Information
The revegetation plan is developed by obtaining an understanding of the road design and by gathering pre-field information on the soil, climate, vegetation, and pollinators of the project site. Much of this information can be obtained prior to visiting the project site. A good pre-field review of information can make the time in the field more efficient and effective.
3.3.1 Climate Pre-Field Assessment
Local climate plays a dominant role in the success or failure of the revegetation effort. Knowledge of local climate factors, including historic climate data and recent trends, can inform the designer and help delineate the appropriate revegetation units and develop achievable DFC targets. In later phases of the planning process, climate data will be used to determine appropriate revegetation treatments.
Obtaining climate records from a variety of sources is the first step in conducting a climate assessment. There are many sources of climate records for the United States (Figure 3-1). One source is the Western Regional Climate Center website that displays the location of the National Oceanic and Atmospheric Administration (NOAA) Cooperative Stations in the United States and provides historical weather data for most stations.
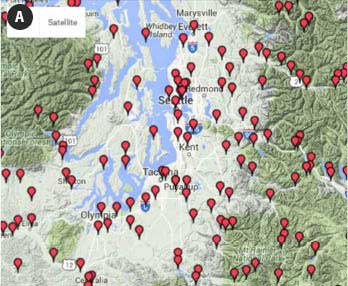
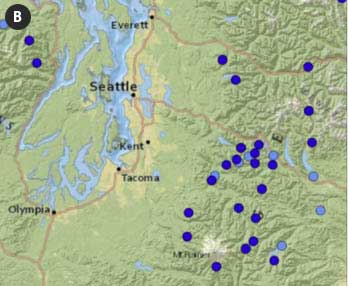
Figure 3-1 | NOAA and NRCS weather stations
The United States has an extensive system of weather stations maintained by National Oceanic and Atmospheric Administration (NOAA) and Natural Resources Conservation Services (NRCS). These maps show the locations of weather stations in the Puget Sound area. Stations administered by NOAA are shown on the left (A) and those by NRCS on the right (B). Historic climate summaries and interpretative graphs for each station can be downloaded from each website.
Each weather station has helpful graphics, such as spring and fall "freeze probabilities" (Figure 3-2) that can be used to determine the best dates for sowing seeds and planting seedlings. Another available graphic is the probability of precipitation throughout the year, which can be used to determine if supplemental irrigation is necessary (Figure 3-3).
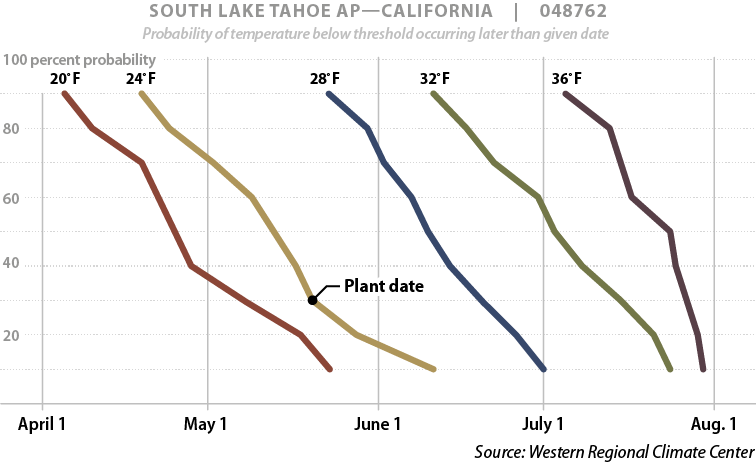
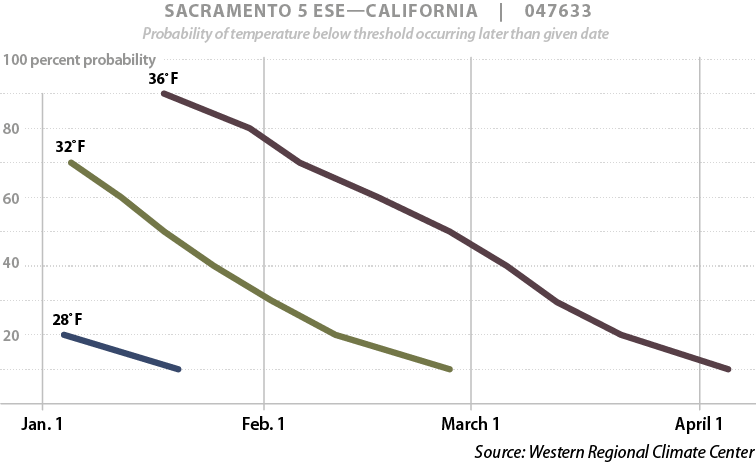
Figure 3-2 | Spring and fall freeze probability graphs
In addition to historic weather station data, the Western Regional Climate Center has many useful graphs (located on the left-hand side of the weather station data screen), such as the "Spring and Fall Freeze Probability" curves. Graph A shows the probability of temperatures dropping to sub-freezing temperatures during the winter through summer in South Lake Tahoe, California. At this site, planting might be planned when there is less than a 30-percent probability that temperatures will drop below 24° F to reduce the risk of seedling damage as the plants are coming out of dormancy. This would put the planting date sometime around the middle of May. In contrast, Sacramento, California, to the west and near sea level has a very different climate as shown in Graph B. According to these curves, it is improbable that temperatures ever reach 24° F in winter and spring; therefore, plants could be installed at any time during the winter.
Source: Western Regional Climate Center
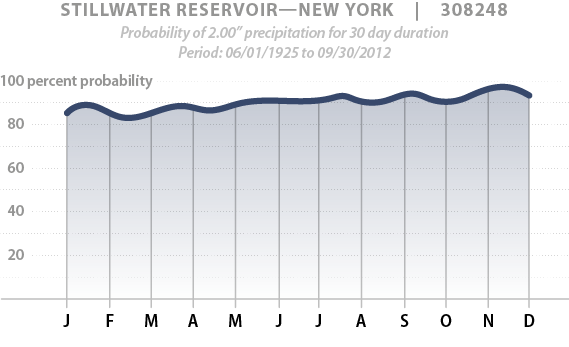
Figure 3-3 | Rainfall probability graphs
Another helpful graph from the Western Regional Climate Center displays the probability of receiving precipitation through the year. The probability of receiving 2 inches of rainfall in a 30-day period for a station in southwestern Oregon (A) indicates that it is highly unlikely this will ever happen during the summer, which may lead the practitioner to consider supplemental watering or some other measure to keep plants alive during the first year after the seedlings are planted. In comparison, the probabilities that 2 inches of precipitation would occur in 30 days in upstate New York (B) any time of the year is more than 90 percent, indicating that irrigation of newly planted seedlings may not be necessary.
Source: Western Regional Climate Center

Finding a weather station closest to the project site will be helpful in understanding the influence climate will have on the project. The PRISM website allows the user to locate the project site on a map of the United States, so instead of using data from a single weather station located miles away from the project, this website creates a weather profile specific to the project site. It does this by extrapolating data from surrounding weather stations using a digital elevation model and expert knowledge of complex climatic patterns. This website also displays weather trends and anomalies (e.g., extreme heat) that can be helpful in planning (Figure 3-4).
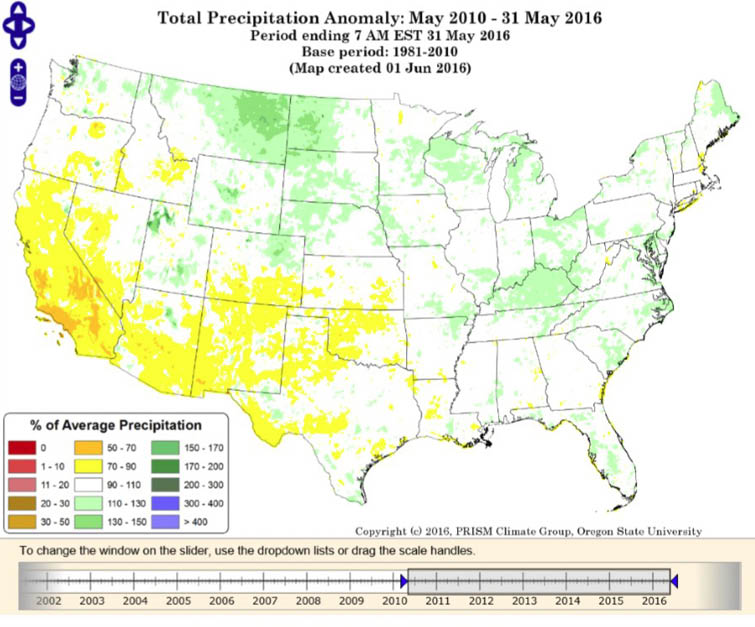
Total Precipitation Anomaly, May 2010 - May 2016
Period ending 7AM EST 31 May 2016 | Base period 1981-2010 | Map created 01 June 2016
Figure 3-4 | Precipitation trends
The PRISM website allows the user to obtain extrapolated weather data for any point in the United States. By identifying the project location on an interactive map of the U.S., a report is generated that summarizes site-specific climate information for that area. In addition, this website displays climate information in a variety of ways that may be helpful in revegetation planning. This map, for instance, shows precipitation trends for the past five years across the U.S., which can be useful during the development of the revegetation plan.
NRCS maintains the National Water and Climate website that reports historic and real-time weather data from automatic weather stations located in remote mountainous areas of the western United States. If a project is located near one of these stations, then it is easy to monitor current weather conditions.
Planning for Climate Change
Climate change effects, including increased frequency of extreme weather events, wildfires, invasive species, drought, increased temperatures, and altered stream flows, can affect native plants and revegetation success on both temporal and spatial scales. Measurable effects of climate change have been observed such as spring events arriving earlier, shifts in species distribution, and disruption of plant-pollinator dynamics. Parmesan and Yohe (2003) showed spring events such as budburst in plants, the arrival of migratory birds and butterflies, bird nesting, and others occurred an average of 2.3 days earlier per decade over 123 years. This same review revealed that the latitudinal and elevational range limits of several alpine plant populations had shifted northward 3.79 miles and upward approximately 20 feet per decade over the past 1,000 years. As a result of these effects of climate change plants, in particular long-lived perennials, are forced to either adapt or migrate (Parmesan 2006).
The migration of plants or changes in plant phenological events have been observed to disrupt or decouple pollinating insect interactions with their host plants. For example, host plants may senesce more quickly than caterpillars develop and other asynchronies between butterflies and their host plants (Parmesan 2007). Some species of pollinators have undergone range contractions due to climate change (Kerr and others 2015). Limitations of dispersal and establishment may mean that many species of pollinators will not be able to keep up with predicted climate change scenarios and that climate change will exacerbate other threats to pollinators, including habitat loss (Settele and others 2016).
For the Designer
The development of climate change decision support tools and their application to revegetation practices is rapidly evolving and generally beyond the scope of this manual. Designers should consult geneticists and other experts for the most current guidance and best management practices for their specific project goals and site conditions. Resiliency, diversity, and adaptability will remain important strategies for both short- and long-term revegetation success (Havens and others 2015). Monitoring will also be critically important for informing and adjusting revegetation practices in a changing climate.
Historic data and more recent climate trends can be a valuable tool for the designer to consider when developing a revegetation plan. Recent studies of climate trends have noted changes that are affecting pollinators and their habitat and have offered recommendations on how designers can adapt revegetation plans to these changing conditions.
Revegetation project designers have an opportunity to address many of these effects of climate change during all phases of their projects. Doing so can increase the overall robustness and health of restorative plant populations, thereby increasing the success of projects. Ways in which designers might address climate change in their revegetation projects include the following.
Diversifying Plant and Seed Sources
Revegetation efforts often occur where previously intact habitats have been disrupted or fragmented. If the area of disturbance is small, such as a localized landslide, the fragmentation might be minimal. It is often the case in roadside revegetation projects however, that the disruption to the original habitat can span miles and remain in place for decades. With these projects the original habitat has often been bisected, the hydrology disrupted, and the area might have experienced multiple disturbances or uses over time. In these instances, it's often valuable to collect plant materials along the entire length of the project area, including reference and adjacent sites, within each provisional seed zone.
Observations of, and collections from, mosaic populations of similar aged plants of the same species often provide opportunities to capture pre-disturbance genetic diversity and mimic natural gene flow patterns. Collecting and sourcing plant material in the direction of climate change conditions (i.e., up the elevation or latitudinal gradient) can potentially incorporate traits needed to compensate for predicted changes due to climate (Breed and others 2013). The Seedlot Selection Tool (SST) is a new mapping application that can assist designers in considering options for obtaining seed and matching seed sources to planting sites based on climatic information. The climates of the planting sites can be chosen to represent current climates, or future climates based on selected climate change scenarios. SST can also be used to identify planting sites that are appropriate for a particular seed source, now and into the future.
Utilizing a Mix of Annual and Perennial Species to Meet Short- and Long-term Goals
There is often a desire to provide quick green up and stabilization to projects with annual plant species. Benefits of annual plants include quick germination and establishment, their seeds can be relatively inexpensive, and they are abundant in the current market. Disadvantages of annual species include the fact that they are short-lived, are often seeded in monocultures, their parental lineage and nativity may be difficult to ascertain, and they can out-compete perennial seeds. Importantly, in the context of climate change, using only annual species does not create a resilient plant community with long term persistence.
At times designers and managers can become frustrated at the slow germination and establishment of perennial seeds. Perennial plants tend to establish deeper, persistent roots and therefore provide longer lasting stabilization than do annual plants however. Native perennials are often seeded in a mixture of grasses and flowering forbs, a practice not impossible with annuals but one that seems underutilized. Due to their outcrossing, one disadvantage of long-lived perennial plants tend to be more susceptible to fitness impacts of inbreeding (Breed et al. 2013).
Developing seed mixes that contain both native annual and perennial seeds, proportional to what is appropriate for the individual project in order to avoid deleterious effects of competition and to mimic the vegetation of the surrounding environs, can exploit the best traits of each while minimizing risks.
Developing Monitoring Plans with Climate Change in Mind
Regular assessments of plant survival and recruitment will assist designers and managers in understanding potential effects of climate change on revegetation success and outcomes. To facilitate adaptive management, detailed records should be kept on plant material sources, the planting scheme (e.g. seeding prescription or seedling numbers and density by species), and site preparation and seeding/planting methods. To make this information available to designers in the future, it must be clearly summarized in the monitoring report (Section 6.6).
Some projects, in particular those that involve wetland construction or enhancement, have monitoring plans ten years into the future or more. Given that plant responses to climate change trend toward upward or northward migration, stratified monitoring may be appropriate for some projects. Designers can stratify monitoring units by elevation band, latitudes, degree days, etc. in an effort to identify any changes in plant communities early. Including adaptive management strategies within the monitoring plan will help identify possible solutions to trends that are learned from monitoring.
3.3.2 Soils Pre-Field Assessment
More than 95 percent of the counties in the United States have soil surveys either completed or in the process of completion by Natural Resources Conservation Services (NRCS). Information from these surveys is available on the Web Soil Survey website. By delineating the road project area on the Web Soil Survey map, a customized soils report specific to the project area is generated (Figure 3-5). Included in the report are profile descriptions, characteristics, and capabilities for each soil mapping unit. A typical profile description is provided and includes topsoil depth, soil textures, rock content, soil depth, available water holding capacity, permeability rates, and drainage classes. More detailed information on each soil series, such as laboratory results for nutrients, water retention curves, and other soil properties, is available at the NRCS National Cooperative Soil Survey Soil Characterization Data website.
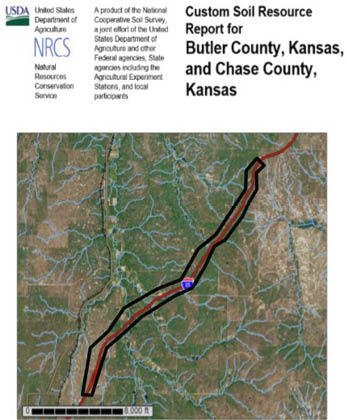
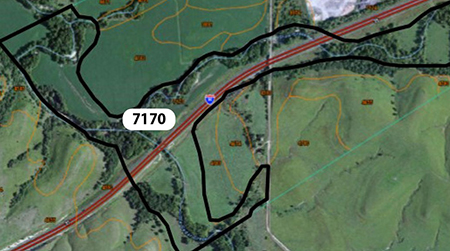
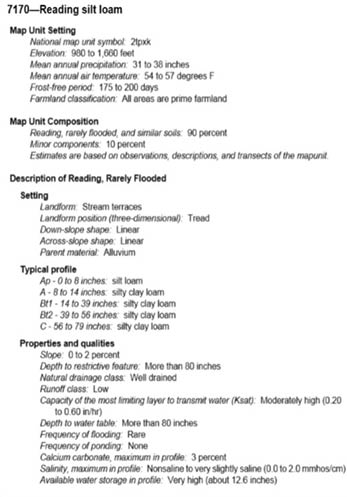
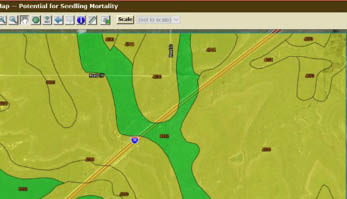
Figure 3-5 | Soils maps generated from the Web Soil Survey website
The Web Soil Survey can be used to develop a custom soils report for most highway projects in the U.S. In this example, a 10-mile stretch of road is being proposed for reconstruction through several counties in Kansas. To understand the soils, the study area is delineated on the Web Soil Survey Interactive Map of the U.S. which generates a site-specific soil report (A). Within the report is a map of the project area with the locations of each soil mapping unit. For each mapping unit, the report describes the soil profile and soil characteristics (C). In this example, a prominent soil mapping unit in the planning area is "7170—Reading silt loam" (B). It is a deep stream terrace soil described in the report (C). The Web Soil Survey also allows the user to query the project site for areas of similar land capabilities or limitations. For this project site, one of the maps generated was areas where high seedling mortalities may be expected (D). Grouping of soil mapping units can also be used in the development of revegetation units.
The information generated from these reports is for undisturbed soils, therefore the use of this information needs to be adapted to the type of disturbance expected to occur within the project. For example, on a project where topsoil is to be removed, it can be assumed that the soil remaining after construction will be the subsoil and not topsoil. The designer would consider the characteristics of the subsoil (B horizon) described in the Web Soil Survey report rather than the topsoil. If the topsoil is to be salvaged, the Web Soil Survey report can provide a general characterization of the topsoil that will be removed. It can also give a good description of an undisturbed reference site soil which may be helpful if restoration of the original site is the objective.
In addition, the Soil Data Explorer portion of the website creates a series of maps based on soil interpretations. Depending on the county the survey was conducted in, a wide range of maps are available, including suitability for hand planting, potential for seedling mortality, forest and range productivity, soil pH, hydrologic soil groups, depth to restrictive layers, and more.
Most lands administered by the USDA Forest Service have separate soils reports in addition to, or in lieu of, the NRCS soils report. These reports are often referred to as a Soil Resource Inventory report and can be obtained at the Forest Service District Office. The agency also maintains a national inventory and mapping ARC-GIS application that includes a soil database as well as information on geology, potential natural vegetation, and Terrestrial Ecological Units Inventory (TEUI).
3.3.3 Vegetation Pre-Field Assessment
Ecoregions and Seed Zones
Ecoregions are defined areas in North America that have similar geographic, vegetative, hydrologic, and climatic characteristics. Several ecoregion systems are available; however, for the purposes of this publication, the ecosystem map developed by the U.S. Environmental Protection Agency are used. The United States is divided into four ecoregion levels, each level representing increasing degrees of detail:
- Level I—12 broad ecoregions
- Level II—25 ecoregions
- Level III—105 ecoregions
- Level IV—967 ecoregions
Because ecoregion maps identify areas with similar environmental characteristics, they are useful in planning, monitoring, information sharing, and management. The Level III ecoregion map has also been used to provide recommendations for seed use and movement of species and geographic areas where empirical genetic information is lacking (Bower and others 2014). Used in conjunction with climate data, such as minimum winter temperature and aridity, Level III ecoregions are a good starting point for guiding source selection of revegetation species. See Chapter 3.13 for a more detailed discussion of seed zones and seed transfer guidelines.
Ecoregional Revegetation Application (ERA)
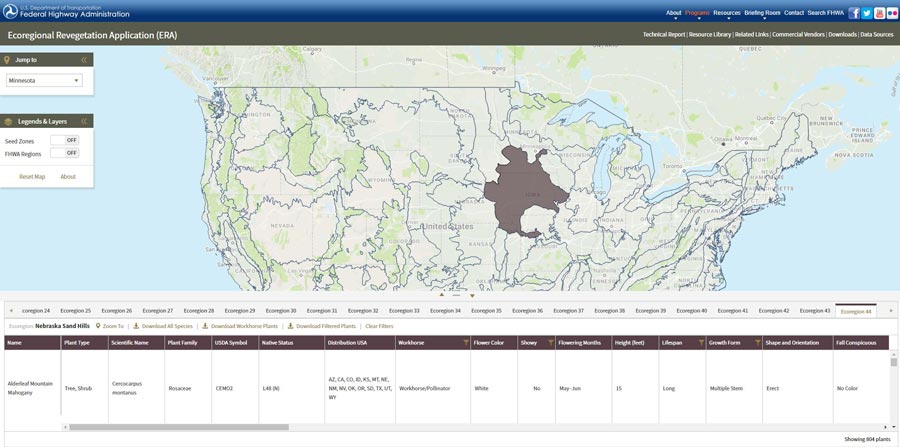
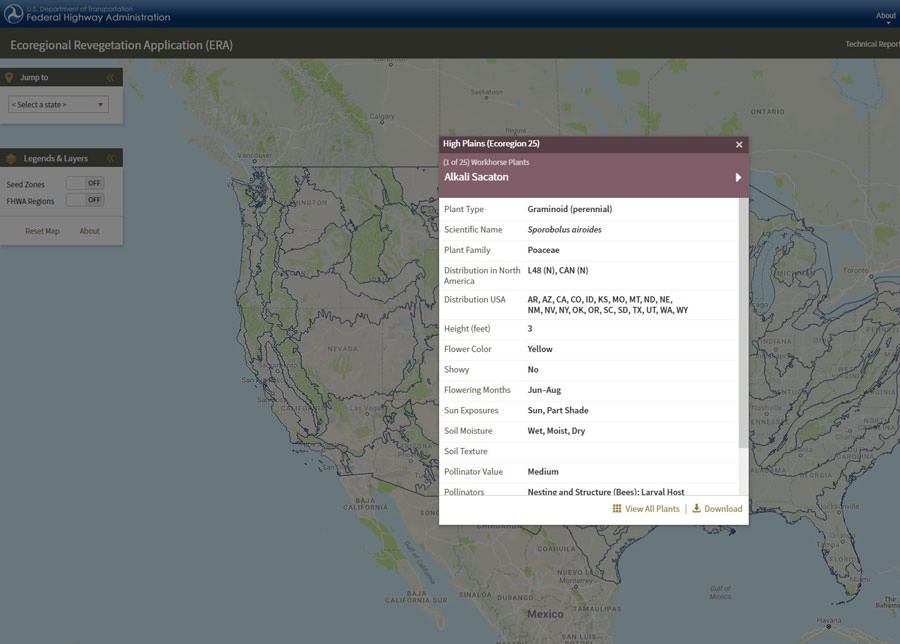
A spatially explicit online planning tool called the Ecoregional Revegetation Application (ERA) has been developed by the FHWA that will list the recommended workhorse and pollinator-friendly plant species for all EPA Level III ecoregions in the continental United States (Figure 3-6). The data used to create these lists were vetted by botanical experts and gathered from reliable sources such as the scientific literature USDA PLANTS database, the USDA Agricultural Research Service pollinating insect unit, and the Xerces Society for Invertebrate Conservation. For each plant species, the ERA will provide attributes such as flowering season and preference for sun that will denote whether a given species is a workhorse (i.e., a reliable and available revegetation plant), or pollinator-friendly (e.g., supports larval or adult pollinators). For pollinator-friendly plant species the selector will denote which general groups of pollinators the plant species will benefit. Moreover, using data generated at the Chicago Botanic Garden (White and others 2016) the ERA will also indicate if a species of interest is commercially available. The first step in revegetation planning, specific to developing pollinator habitat, will be to use ERA to identify potential workhorse plant species for the project area. From this list, other plant species may be selected based on development of a site-specific pollinator working group (Section 3.13.1).
Figure 3-6 | ERA—An online planning tool to select workhorse and pollinator-friendly species
The Ecoregional Revegetation Application (ERA) allows the designer to obtain a list of appropriate workhorse and pollinator-friendly plant species for any location in the United States. Each workhorse species will display the plant attributes important for plant establishment and pollinator habitat enhancement.

3.3.4 Pollinators Pre-Field Assessment
During the early stages of planning, it is important to identify "at-risk" pollinator species that may be affected by the project so that special measures can be taken to protect or enhance populations. A good source for identifying at-risk species is the Xerces Society Red Lists website. This site lists bees, butterflies, and moths that are at-risk by state. It also provides links to recovery plans for species listed under the Federal Endangered Species Act. NatureServe Explorer is a searchable database of plant and animal species in the U.S. that includes conservation status information. Other sources of information for at-risk pollinators are the wildlife and forestry departments of state and federal agencies.
Many good websites are devoted to pollinator species. The BAMONA (Butterflies and Moths of North America) (Figure 3-7) and eButterfly websites are citizen scientist websites that provide access to data about butterflies and moths in North America. Sightings of butterfly and moth species are shown on maps of the U.S. for many species on these websites, including a description of each species. These maps allow the designer to determine if specific pollinator species are near the project area. The crowd-sourcing website, BugGuide, is an online citizen science group that collects images of North American insects and offers an insect identification service for submitted images. Specific to the monarch butterfly is the Monarch Joint Venture website. This is a good resource for monarch butterfly biology, and the site also presents a map that displays current monarch butterfly sightings throughout the U.S.
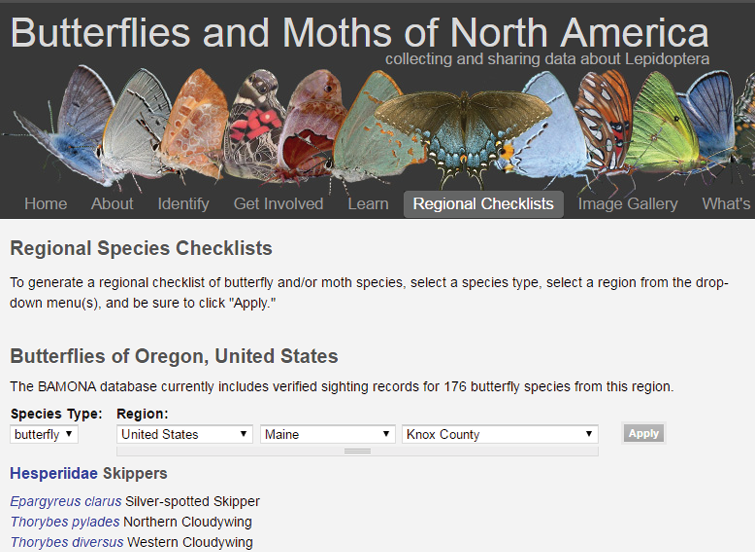
Figure 3-7 | BAMONA website displays pollinator sightings for locations around the US
Websites, such as the BAMONA, can display specific locations where pollinators have been sighted. The search for a specific county in Maine brings up a list of butterfly and moth sightings.
3.3.5 Road Plans
Understanding the design of the road project and how the site will appear after construction are important in developing a revegetation plan. Prior to a field review, an evaluation of road plans and reports should be conducted. Road plans show road cuts, road fills, drainages, ditches, disposal areas, abandoned roads, and engineered structures, which typically require different revegetation strategies. As discussed in the next section, these road components often become the basis or foundation of the revegetation unit map. Most road plans include a series of cross sections that provide slope steepness and shape, components that directly guide revegetation design. Many road projects include Storm Water Pollution Prevention Plans (SWPPP) that describe how water will be controlled, directed, and treated. These reports address the requirements and expectations for soil cover and revegetation and should be understood prior to developing a revegetation plan. Refer to Section 2.4 for how to read road plans, profiles, cross-sections, and typical views.