ROADSIDE REVEGETATION
An Integrated Approach to Establishing Native Plants and Pollinator Habitat

6.4 Pollinator Monitoring Procedures
The monitoring procedures presented in this section provide instructions for monitoring bees, butterflies, and monarch butterflies to assess the quality of revegetated roadsides as pollinator habitat. The data collected from these procedures will allow the project designer to determine if the revegetation project successfully addressed pollinator-specific DFCs. These procedures can be used to assess roadside habitat in a number of ways, such as determining (1) whether revegetation efforts have increased pollinator richness and abundance (by including nearby non-revegetated roadsides in samples as reference sites), (2) if pollinator richness and abundance change over time, (3) the effects of different roadside management strategies or seed mixes on pollinators, and (4) habitat quality and survival rates for monarch butterflies.
Three monitoring procedures are presented in this section.
- Bee abundance procedure—This is a standardized, streamlined monitoring procedure that provides estimates of bee abundance and involves minimal time and training. It involves establishing transects in the project and conducting timed assessment to observe and count the abundance of bees on flowers. This procedure can be used to statistically compare the quality of sites or seed mixes for pollinators and assess changes in pollinator populations over time. This procedure can be conducted on the same transects as those established for soil and plant monitoring (Section 6.3).
- Bee and butterfly diversity procedure—This procedure provides methods for measuring morphogroups of bee and butterfly species along transects in the project. While it involves some training and practice, this procedure generates robust data that is useful for detecting community-level changes in bee or butterfly abundance and richness.
- Monarch butterfly reproduction and habitat procedure—This procedure outlines methods to measure the abundance of host plants for monarch butterflies and the density of monarch eggs and larvae. Obtaining this data entails a moderate amount of time and expertise, but they can be used to quantify host plant availability and survival rates of monarchs.
In all of these procedures, it is important to standardize the sampling effort and weather conditions. Weather conditions strongly influences pollinator behavior. Pollinators are uncommon during cold, windy, or overcast weather, so it is best to monitor under optimal and consistent conditions when monitoring adult bees or butterflies. Optimal conditions for sampling pollinators include sampling between 10 a.m. and 4 p.m. on days with air temperatures over 60° F, wind speeds less than 10 miles per hour, and skies mostly clear. If sampling over time, monitoring is conducted using the same procedure over the same area at roughly the same phenology stage or the same weeks and months every year and under similar weather conditions.
It is important to note that counting individual European honey bees alone cannot provide a measure of the value of habitat for native bees or other pollinators because the number of individual honey bees visiting habitat is primarily determined by the number of managed hives in the vicinity. Although the presence of honey bees does indicate that the vegetation supports bees, it does not demonstrate how well the vegetation increases abundance and diversity of unmanaged bees and other pollinators.
Pollinator populations vary over the course of the growing season and from year to year. If a species of interest is to be targeted using monitoring (e.g. monarch butterflies), it is useful to schedule monitoring according to their flight period. Pollinator populations also vary annually, increasing as plants become established and mature, which may take several years after seeding or planting. For this reason, monitoring procedures are conducted for multiple years after a revegetation project has been completed.
6.4.1 Bee Abundance Monitoring Procedure
Overview of procedure
- What the procedure will measure—Wild bee and honey bee abundance
- Sampling design—Transects within the project area
- Sampling frequency—Two visits per growing season (at minimum)
- Sampling timing—Warm, sunny, and calm days, between 10 a.m. and 4 p.m.
- Level of identification needed—Distinguish bees from all flower visitors; distinguish native bees from European honey bees
- Equipment needed—Stopwatch or clock, data sheets, clipboard and pencils, long measuring tape (100 meters), flags/stakes to mark transects, GPS device, this procedure and pollinator identification guide
- Personnel needed—Can be conducted by a single person, but easier with two
- Workbooks—Bee Abundance Monitoring Procedure workbook
This streamlined monitoring procedure provides a quantitative measurement of bee abundance and can be conducted with minimal time and training. The surveyor must be able to recognize bees from other insects visiting flowers, and distinguish honey bees from native bees (see Native Revegetation Resource Library for more information about this level of identification). Two separate visits are made in a growing season to conduct a timed assessment to observe and count bees on flowers. During each visit, observations are made along transects. Surveys are conducted in the middle of the growing season, at least one month apart. In California, for example, May through July is the ideal survey window, while in the Upper Midwest or Northeast, July through August is preferred. Monitoring is conducted only when weather conditions are warm, sunny, and calm, with air temperatures over 60° F, wind speeds less than 10 miles per hour, and skies mostly clear. Pollinators are most active between 10 a.m. and 4 p.m.
This procedure can be implemented with one person, but it is easier with a two-person team (Figure 6-17). When using two people, one person observes and counts bees while the other records the data and tracks the time and weather conditions. A field data and analysis form in the Bee Abundance Monitoring procedure workbook can be downloaded from the Native Revegetation Resource Library.
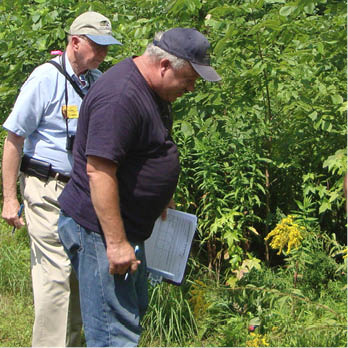
Figure 6-17 | Two-person monitoring teams
With a two-person monitoring team, one person counts pollinators and the other records the data and tracks time.
Photo credits: Michael Kent, Cape Atlantic Conservation District
Bee counts are made along multiple transects perpendicular to the road across the entire length of a roadside sampling area, as described in Section 6.3.6. The bee counts can be conducted on the same transects and at the same time that Soil Cover, Species Cover, and Species Presence procedures (Section 6.3.1, Section 6.3.3, Section 6.3.1) are conducted. However, the bee abundance monitoring is conducted prior to the Soil Cover, Species Cover, or Species Presence procedures to reduce disturbance that could disrupt bee activity.
For each transect, a measuring tape is laid out from the edge of the road shoulder to the outer roadside edge (Figure 6-18). The length of each transect determines the time spent counting bees on each transect. Plan on spending approximately one minute counting bees for every 10 feet of transect. For example, if the transect length is 35 feet, then time spent counting bees for that transect would be 3.5 minutes. To reduce the disturbance to bees prior to sampling, only one person lays out the measuring tape and then stays clear of the tape while walking back to the beginning of the transect.
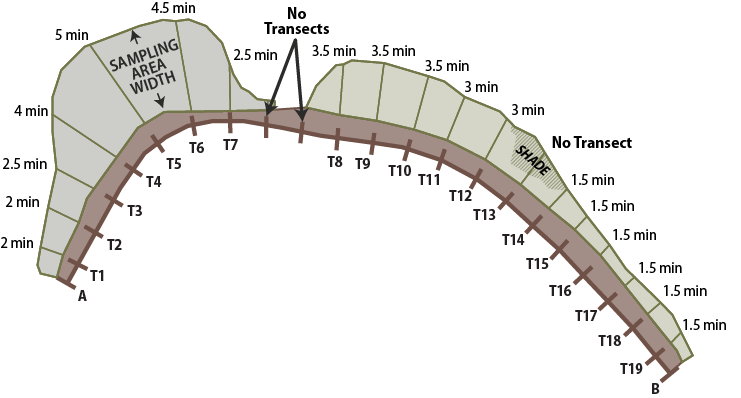
Figure 6-18 | Transect layout on roadsides for Bee Abundance monitoring procedures
Multiple transects for pollinator surveys are laid out similarly to those described in Section 6.3.6 for each roadside sampling area. In this example, survey times are based on 1 minute per 10 feet of transect. Transects that are shaded from the sun are not sampled, nor are transects that are less than 10 feet.
Transects typically start from the road and end at the outer edge of the roadside. In situations where the shadow of the surveyor is directly in front of the direction of travel, the transect recording begins at the outer edge of the roadside and travels to the road. If the entire transect is shaded, then this is noted on the data sheet. Bee activity declines in shaded areas.
At the start of each transect, the data recorder starts the stopwatch and the observer begins to count bees, covering about 10 feet of the transect per minute. The observer chooses the side of the transect with the least shadow and observes the flowers within 3 feet of the transect line. While walking transects, each bee that lands on the reproductive structures of the flower is recorded. Bees that are perching on leaves or petals are not counted. If performing the monitoring with just one person, a timer is used and the timer is paused as needed to record a bee. The timer is restarted when observations resume.
While moving along the transect, a tally of the number of native bees and honey bees is recorded. The same individual bee is not counted twice, even if it visits multiple flowers, because the overall goal is to count the number of individuals using the site rather than the rate of floral visitation.
At the end of each transect, the recorder tallies the number of pollinators, the travel time, time of day, the length of transect, transect number, and weather conditions. If other monitoring procedures (e.g., Soil Cover, Species Cover, and Species Presence) are to be conducted, the team returns to the beginning of the transect and conducts these procedures.
Records of roadside sampling areas also include the site name, sampling area designation, date, name of the sampler, weather conditions, time of visit to the site, and any pertinent notes about the site. It is also valuable to record the plants that are blooming along the transect at the time of the survey, as well as to collect data on the floral associations of the bees at the site. The data sheet is available at the website mentioned previously. This procedure was adapted from a procedure developed by researchers with the University of California, Davis; Rutgers University; Michigan State University; and The Xerces Society (Ward and others 2014).
Data Analysis
To determine overall abundance per roadside sampling area, the number of individual bees observed during each monitoring event is tallied. Then, the monitoring events per year are averaged. To determine the number of honey bees and the number of native bees per transect-foot, the total number of bee counts of all transects in a field visit is summarized and divided by the total transect distance. This number can be can be used to compare with other field monitoring visits.
A second analysis method is based on the statistical methods outlined in Section 6.3.7. Using this method, field data is entered into the Bee Abundance Monitoring procedure workbook, which calculates mean and confidence intervals for honey bees and native bees for each sampling area. Confidence intervals can be used to determine if there are significant changes in populations between sampling areas or dates. This analysis can also be used to correlate findings from Soil Cover, Species Cover, and Species Presence procedures. For example, using data from each transect, a regression analysis of bee populations to floral density (Section 6.3.2) could be analyzed. Other regressions could include percent bare soil, specific plant species, and species richness.
The number of native bees counted through this monitoring procedure correlates positively with the overall diversity of native bees at a site; therefore, if a large abundance of individuals is present, that indicates higher diversity (Ward and others 2014). If multiple roadside sampling areas are surveyed, the differences observed in native bee abundance reflect differences in habitat quality among sites. Native bee counts can be used to rank the quality of sites or the quality of seed mixes, or can be used over time to assess changes at a site. Note that honey bee abundance cannot provide a measure of the value of habitat for native bees or other pollinators because the number of individual honey bees visiting habitat is determined by the number of managed hives in the vicinity.
6.4.2 Bee and Butterfly Diversity Procedure
Overview of procedure
- What the procedure will measure—Abundance and richness of bees and butterflies
- Sampling design—Transects within the project area
- Sampling frequency—Three visits per growing season, at a minimum—late spring, mid-summer, late summer
- Sampling timing—Warm, sunny, and calm days, between 10 a.m. and 4 p.m.
- Level of identification needed—Identify morphological groups (morphogroups) of bees and groups of butterflies
- Personnel needed—Two people: one person to identify pollinators, one to keep time and record data
- Equipment needed—Stopwatch or clock, data sheets, clipboard and pencils, long measuring tape (100 meters), flags/stakes to mark transects, GPS device, this procedure and pollinator identification guide, and plant lists and plant identification guide (see Native Revegetation Resource Library)
- Workbooks—Bee and Butterfly Diversity Monitoring Procedure workbook (see Native Revegetation Resource Library)
Procedure Details
This procedure provides measurements of bee and butterfly abundance, as well as the number of bee species (richness). It can be challenging to identify pollinators. For example, most native bee species can only be identified to species by examining pinned specimens under the microscope and obtaining confirmation from experts. In fact, standard pollinator monitoring techniques typically employ destructive sampling, with specimens collected with nests or traps, pinned, and then identified by a taxonomist. While these collection techniques provide the most robust data, they can be labor intensive, time consuming, and expensive. Collecting observational data on pollinators is an economical and effective alternative to monitoring pollinators, as long as the observers have had some training and practice in order to recognize and monitor pollinators. This procedure can be used to collect consistent observational data on bee and butterfly communities. The procedure is based on a standardized method designed by researchers and practitioners (Kremen and others 2011; Minnerath and others 2016).
The goal of this procedure is to identify specific associations between pollinators and their habitat. Monitoring takes place along transects, which are located within sampling units that have relatively uniform vegetation and site characteristics (Figure 6-19). If the project is large or composed of several different plant communities, then several sampling units may be delineated and sampled separately. The number of transects placed in a sampling unit depends on the size of the unit and topographic relief:
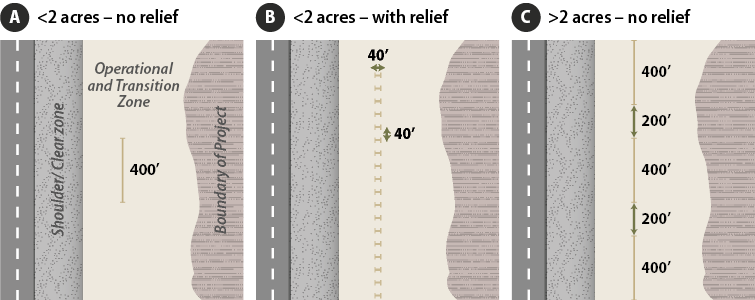
Figure 6-19 | Transect layout on roadsides for Bee and Butterfly Diversity monitoring procedures
- <2 acres - no relief—establish one 400 feet transect through the middle of the area outside of the clear zone, running parallel to the road (Figure 6-19A)
- <2 acres - with relief—orient multiple transects of equal length that add up to a total of 400 ft. running perpendicular to road (for ease of walking the transect) and spaced apart evenly. Figure 6-19B shows a sampling area where 10 transects averaging 40 feet in length were laid out for a total of 400 feet.
- >2 acres - no relief—establish three 400 feet transect through the middle of the area outside of the clear zone, running parallel to the road separated evenly (Figure 6-19C)
- >2 acres - with relief—orient multiple transects of equal length that add up to a total of 1,200 ft. running perpendicular to road (for ease of walking the transect) and spaced apart evenly.
If making comparisons between sites, it is best to keep the individual transect length and the distances between transects constant. For sites that are greater than 2 acres in size, three 400-foot-long transects are used that are spaced evenly throughout the site. Transects are located in full sun where possible (or notations are made on data sheets when in shade) because pollinator activity declines in shade. GPS coordinates are taken to allow others to monitor the area in the future.
Monitoring is conducted at least three times a growing season, ideally monthly. This is because many bee and butterfly species fly for a limited number of weeks each growing season, and the communities may differ greatly between samplings. It is important to be consistent from year to year in the frequency of monitoring so that comparisons between years can be made.
Weather conditions strongly influence bee and butterfly behavior. Bees avoid activity on cold, windy, or overcast days, so monitoring is optimal when sampling on days with air temperatures over 60° F, wind speeds less than 10 miles per hour, and skies mostly clear. Standardizing the time of day that sampling occurs is also important. Pollinators are most active between 10 a.m. and 4 p.m.
These procedures can be implemented by observers working on their own or in pairs, with one person to act as an observer and the other to record observations and data. It is easiest to conduct observations of bees and butterflies on separate walks of the transects to help focus identification.
When making observations of floral visitors in a transect:
- Insects should be observed carefully and only identified to a level at which the surveyor is confident.
- Insects visiting flowers should not be disturbed before an observation can be made. The surveyor should walk slowly and avoid sudden movements. Insects will respond to shadows passing overhead, so the surveyor should walk so as not to cast a shadow where observations are to be made.
Bee Monitoring
The transect is walked at a steady pace, such as 10 feet per minute; expect each 400-foot-transect to take 40 to 60 minutes. The surveyor walks slowly, not spending more than a couple of observational minutes at any flower or group of flowers. The time spent walking transects should be consistent so that the data is collected with the same level of effort to allow for comparisons between samples.
Only bees that are on the reproductive parts of the flower are identified and recorded (Figure 6-20). Bees sitting on petals, leaves, or in flight are not recorded. When a bee is visiting a flower, the bee is observed and identified using the identification guides presented in the Native Revegetation Resource Library. It can also be helpful to note other floral visitors beyond bees, and the species of the flower on which the bees are observed. If more than one floral visitor is observed on a single flower, the number of visitors is noted first and then they are identified. After the bee data is collected, each additional flower species that is in bloom but did not have floral visitors during the survey is noted.
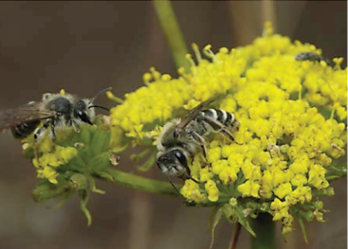
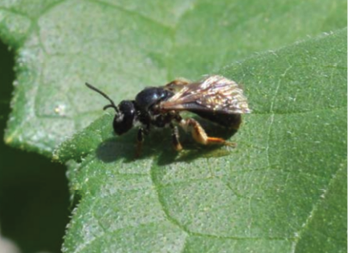
Figure 6-20 | Recording bee visits
When recording bee visits, only bees present on reproductive parts of flowering plants (A) but not on leaves, petals, or in flight (B) are recorded.
Photo credits: Mace Vaughan, Xerces Society (A), Sara Morris, Xerces Society (B)
Butterfly Monitoring
This monitoring procedure is based on the standardized Pollard Walk (Pollard and others 1975) and can be used to collect observational data on the abundance and richness of butterflies. The objective of this procedure is not to count all butterflies present at the entire site or within the habitat being monitored, but to count those individuals that occur in, or move through, the transect' s sampling area while the surveyor is walking a steady pace of 10 feet per minute. The surveyor identifies and counts butterflies on flowers or in flight if they occur within approximately 15 feet on each side of the transect or overhead of the surveyor. Butterflies that fly in from behind the surveyor are not counted to avoid counting the same individual twice. Butterflies are identified to the level most comfortable to the surveyor (refer to butterfly identification guide) and recorded as whether the butterfly was observed in flight or nectaring on a flower. If the butterfly is nectaring, it can be helpful to record the species of the plant on which the butterfly was feeding.
Considerations include:
- It is important to be consistent, using the same level of effort with each time transect.
- The time spent walking the transect is recorded each time.
- It is recommended that records of observations include the site name, date, name of the sampler, weather conditions, time of visit to the site, and any pertinent notes about the site.
- It is also valuable to record the plants that are blooming along the transect at the time of the survey, as well as to collect data on the floral associations of the pollinators at the site.
Data Analysis
To draw meaningful conclusions about the effects of roadside habitat on bees and butterflies, data is collected consistently over time in the same areas. To determine changes in abundance over time, the number of individuals observed during each monitoring event is tallied (transects can be combined if multiple transects are sampled). These numbers can be averaged for each year (e.g., the results from late spring, mid-summer, and late summer can be averaged) and plotted on a graph or table to show changes between years. The numbers of individuals can also be totaled for each monitoring event and evaluated separately. Honey bee counts may be excluded in some analysis because the placement of hives influences their abundance.
To calculate species richness for each sampling period or each year, the total number of bee morphogroups and butterfly groups that were observed are tallied. Richness can then be plotted to record changes over time, whether comparing the average or total number of groups observed across all sample periods for each year, or comparing the total number of groups observed during a certain sampling period from year to year.
As noted before, pollinator populations vary over the course of the growing season and from year to year, so it is important to schedule monitoring accordingly. Pollinator populations also vary annually, increasing as plants become established and mature, which may take several years after seeding or planting. For this reason, monitoring is conducted for several years or more after the project has been completed, ideally 3 to 5 years. The longer sites are surveyed, the more meaningful the results.
6.4.3 Monarch Butterfly Reproduction and Habitat Procedure
Overview of Procedure
- What the procedure will measure—abundance of milkweed plants, abundance of nectar plants in bloom, abundance of monarch eggs and larvae
- Sampling design—Transects within the project area, with uniformly spaced quadrats along each transect
- Sampling frequency—Once a growing season during the breeding season of monarchs, at a minimum
- Sampling timing—Warm, sunny, and calm days between 10 a.m. and 4 p.m.
- Level of identification needed—Recognize monarch butterfly eggs and larvae, identify milkweed species, identify target nectar plants
- Personnel needed—Two people: one person to identify plants, one to search for monarch eggs and larvae
- Equipment needed—Stopwatch or clock, data sheets, clipboard and pencils, long measuring tape (100 meters), flags/stakes to mark transects, GPS device, 1m x 1m quadrat, this procedure and monarch egg and larval identification guides, and plant lists and plant identification guide (see Native Revegetation Resource Library)
- Workbooks—Monarch Butterfly Monitoring Procedure
Procedure Details
Monarch butterfly populations have recently declined to dangerously low levels and are being considered for listing under the Endangered Species Act. If the project area is within the distribution of the monarch butterfly, it may be important to conduct monarch monitoring. Monarch butterflies have a range that extends across most the United States (exceptions include western Washington and parts of western Oregon where their host plants do not occur) and into southern Canada and northern Mexico.
This procedure outlines how to measure (1) abundance of milkweed, (2) abundance of nectar plants, and (3) density of monarch eggs and larvae. Measurements are made along multiple transects perpendicular to the road across the entire length of a roadside, as described in Section 6.3.6, see Linear Areas and as shown in Figure 6-18. This procedure can be conducted on the same transects and at the same time that Soil Cover (Section 6.3.1), Species Cover (Section 6.3.2), and Species Presence procedures (Section 6.3.3) are conducted. However, the monarch egg and larval monitoring is conducted prior to the Soil Cover, Species Cover, or Species Presence procedures to reduce disturbance that could dislodge caterpillars from milkweed plants.
For each transect, a measuring tape is laid out from the edge of the road shoulder to the outer roadside edge. Vegetation is sampled at quadrats spaced every 20 feet along the transects. Milkweeds, nectar sources, and monarch eggs and larvae are sampled within each quadrat. A 1m x 1m quadrat frame is constructed with PVC pipe and corner connectors.
A workbook that contains data forms for milkweed abundance, nectar plant abundance, and monarch eggs and larvae density is available in the Native Revegetation Resource Library.
Milkweed Abundance
The number of plants and stems of milkweed species that are rooted within the quadrat are recorded. A milkweed plant is defined as all above-ground stems originating from a single identifiable common point in the ground. One milkweed plant may be composed of one or multiple stems, depending on the species. For example, green antelopehorn milkweed plants (Asclepias viridis), butterfly milkweed (A. tuberosa), or swamp milkweed (A. incarnata) may grow multiple stems per plant. When these plants are found, each cluster of stems originating from a single point is counted as a single plant (Figure 6-21). Multiple stalks from a single point are recorded as a single plant with multiple stems. Some species, such as common milkweed (A. syriaca) or whorled milkweed (A. verticillata), grow multiple stalks, and it is impossible to discern if the stalks are from the same plant without excavating the roots. Each individual stalk that does not originate from a central point and is separated by soil is therefore counted as a separate plant. Data on the number of plants, as well as the number of stems per plant, is recorded to determine milkweed density per area.
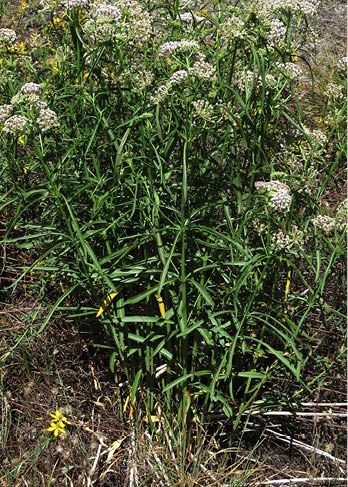
Figure 6-21 | Milkweeds may have multiple stems from one plant
Milkweeds with multiple stems are recorded as a one plant.
Nectar Plant Abundance
Within each quadrat, the species with blooming flowers and the number of plants is recorded. After monitoring is completed, at the end of the growing season, gaps in bloom or times when species diversity was low can be identified.
Density of Monarch Eggs and Larvae
To determine the monarch density per plant, monarch butterflies are recorded within each quadrat and within a 10-foot swath between quadrats. Each milkweed that is encountered within a quadrat is examined for monarch eggs and larvae. The numbers of eggs and larvae are recorded for each quadrat. For plants within the 10-foot swath between quadrats, the number of milkweed plants and stems by species and the number of eggs and larvae observed on these stems are recorded separately (e.g., quadrat 3—quadrat 4). The collected data is used to determine the monarch density at the site, calculated as a proportion of milkweed plants with monarchs.
All parts of the milkweed plant are carefully examined, including the bottoms of the leaves, the area within the small leaves at the top of the plant, and buds and flowers if they are present. Eggs are very tiny, about 1 mm wide, and are cream colored (Figure 6-22). Early instars of caterpillars are also very small, 2-6 mm in length. Monarch caterpillars leave clues such as chew marks on the leaves that indicate their presence (Figure 6-23). It is important to handle the plants carefully to avoid dislodging any larvae. Photographs of the egg and caterpillar are helpful to distinguish monarchs from other insects. Monarch eggs and larvae can be hard to find.
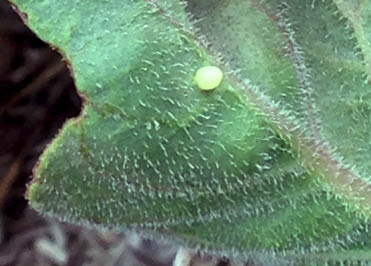
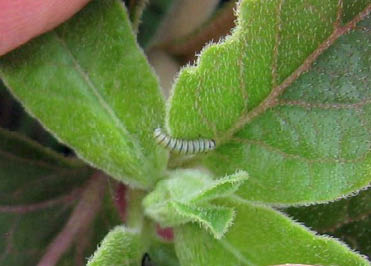
Figure 6-22 | Monarch butterfly eggs and caterpillars
Monarch eggs are often deposited singly on the underside of milkweed leaves (A), and early instar caterpillars can be found on milkweed vegetation or on flowers (B).
Photo credits: Stephanie McKnight/Xerces Society (A); Anne Stine/Xerces Society (B)
These procedures were adapted and modified from the Monarch Conservation Science Partnership Monarch Monitoring Trial Protocol, the Monarch Larva Monitoring Protocol, and the Prairie Reconstruction Initiative Retrospective Research protocol (personal communications: Laura Lukens, University of Minnesota, January 3, 2017; Diane Larson, United States Geological Survey, January 6, 2017).
6.4.4 Pollinator Plant Monitoring
Monitoring plant species found on a project site is a method of assessing potential pollinator habitat. This involves collecting and evaluating data from any or all plant monitoring procedures outlined in Section 6.3. To do this, plant species recorded during these surveys are categorized as to whether they are pollen or nectar producers, flowering times, plant structure, or any other characteristics important for pollinator habitat. Some of these plant characteristics are available on the ERA.
Figure 6-23 | Chew marks on milkweed leaves indicate the presence of monarch butterflies
An indication of the presence of monarch butterflies is the chew marks on milkweed leaves.
Photo credits: Jennifer Hopwood, Xerces Society
DFC targets developed during planning can be referred to for grouping plant species. For example, a DFC target may be "50 percent of the plant cover will be composed of flowering species." Using the Species Cover monitoring procedure (Section 6.3.2), plant species are grouped as "flowering" and "non-flowering," and the percent cover for each group is summarized. Using the analysis procedures described in Section 6.3.7, it could be determined statistically whether the DFC target was achieved.
DFC targets can also include overlapping bloom time throughout the growing season so that flowering species are available sequentially for pollinators.